Having Google Analytics set up on your website but not really knowing what it does or how to use it, is more or less, living in darkness.
You can’t grow and improve your business and have it produce fruitful results unless you know which areas to focus on, what needs improvement and what is doing well. In order to know that, you need to have a good understanding of Google Analytics and the ability to analyze your own data.
I often write about the various features of Google Analytics and useful techniques to make the best use of the tool in order to improve your marketing efforts, but for the sake of this article, I’ll stick to the very basics and how our analytics team helped a client understand their content marketing efforts using Google Analytics and analyze data with an easy-to-understand data studio report.
About the Client
“Harris School Solutions” provides software solutions for utilities, healthcare, local government, public safety, and schools throughout The United States and Canada.
Content marketing is one of the primary methods they use for lead generation, and their very competent content team, is responsible for taking care of creating the compelling drafts.
The Challenge
They already had Google Analytics connected to their website but data collection and analyzation was their biggest challenge. They were struggling to understand user behavior and content efficiency.
After they contacted us for help, we went through their existing analytics setup. Listed in the following, are the steps we followed, and the improvements we made.
- Made sure they have implemented analytics correctly on their website(root + subdomains)
- Made sure the analytics data is accurate and trustworthy
- Set up the right marketing goals so that they can measure conversions.
Our Approach
The very first thing we do for our clients is a Google Analytics audit. This helps us figure out any issues with the analytics setup, what’s working, what’s not, and make any possible recommendations to improve the existing setup.
So, following our approach, we took some time to audit theirs. The most crucial of our findings are listed below:
- Their current setup comprised of four different domains as part of their business and three of them were missing Google Analytics tracking code. So there was no cross-domain tracking set up and the current analytics setup was missing data from other domains.
- Their current Google Analytics account was missing conversion tracking. Macro business goals were not added to the current setup due to which a proper conversion tracking was missing.
- The existing funnels had some duplicate goals.
- Spam traffic was being recorded, which was diluting the data.
In the analytics audit report, we mentioned all the issues found with their analytics and added recommendations to remedy them. Our main recommendation was to set up Google Tag Manager to track the micro conversions.
Micro conversions are all important actions that lead the user towards the macro conversion, which is the main goal or purpose of the entire website. These include CTA button clicks, form submissions, newsletter signups, and downloadable resources.
We also advised in favor of setting up custom dimensions and metrics so they could track additional user and session data. The basic purpose of using custom dimensions was to measure individual user behavior towards the conversion.
The final recommendation was to migrate from the conventional custom reporting in Google Analytics to a more dynamic experience in The Google Data Studio. We proposed having a centralized dashboard that measures all key marketing aspects and having it placed on site within a single page.
Our Efforts
The report we delivered detailed the audit and analysis we conducted and the client was pleased with the progress and satisfied with the recommendations we made to improve their existing set up.
Although there are many things involved in data collection and the configuration process, in the following are the two most important ones:
1. Implementation of the Google Tag Manager:
We started with migrating their analytics implementation to Google Tag Manager and set up cross domain tracking for all their websites.
The next step was to use Google Tag Manager for tracking events which were considered to be micro conversions. We set up tracking for all the CTA clicks, form submissions, and social link clicks as per our recommendation in the analytics audit.
Tracking all these events on the website was to help the client get a feel of the user behavior. The goal was to help them understand the performance of their content marketing efforts, so we had to measure what people actually do after landing on the blog.
Setting up scroll tracking on the blog helped in measuring whether the visitors read the blog posts and if so, what do they do next. What specific actions take them to the contact page and convince them to submit a form.
For conversion tracking in Google Analytics, we created event-type goals. Using Google Tag Manager for conversion tracking helped us set up the required goals in analytics easily.
The next step was to figure out what visitor lands on the blog page, navigates to lead page and, submits a form. Here is why we used sequential segments in Google Analytics.
2. Using sequential segments to measure user behavior:
Sequential segment is a type of advanced segments, which is used for measuring user actions in a sequence. For a content marketing website, the sequence could be that the users land on the blog page, then click a CTA button, go to the contact us page, and submit a form.
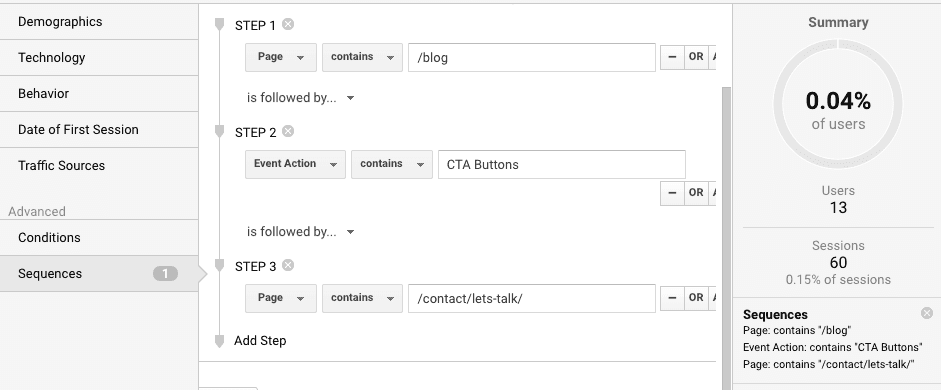
We created sequential segments to determine the user behavior for different lead pages. This would definitely help the content marketing team to identify which type of blog posts lead to most conversions.
Data Studio Blog Performance Report
For the content marketing team, we had to create a simple and easy-to-understand report that would help them understand the blog’s performance. When it comes to reporting, we have to be careful about displaying only the data that is important for the business.
We focused on creating a simple report that would display the following data.
- Blog users important metrics(users, new users, sessions, avg. session duration..)
- The most popular blog posts
- How people found the blog(source/medium)
- How far do users scroll down the blog posts
- Blog reader location and the devices used
- Blog to contact us conversions on each domain.
The following is how the final blog performance report looked like.
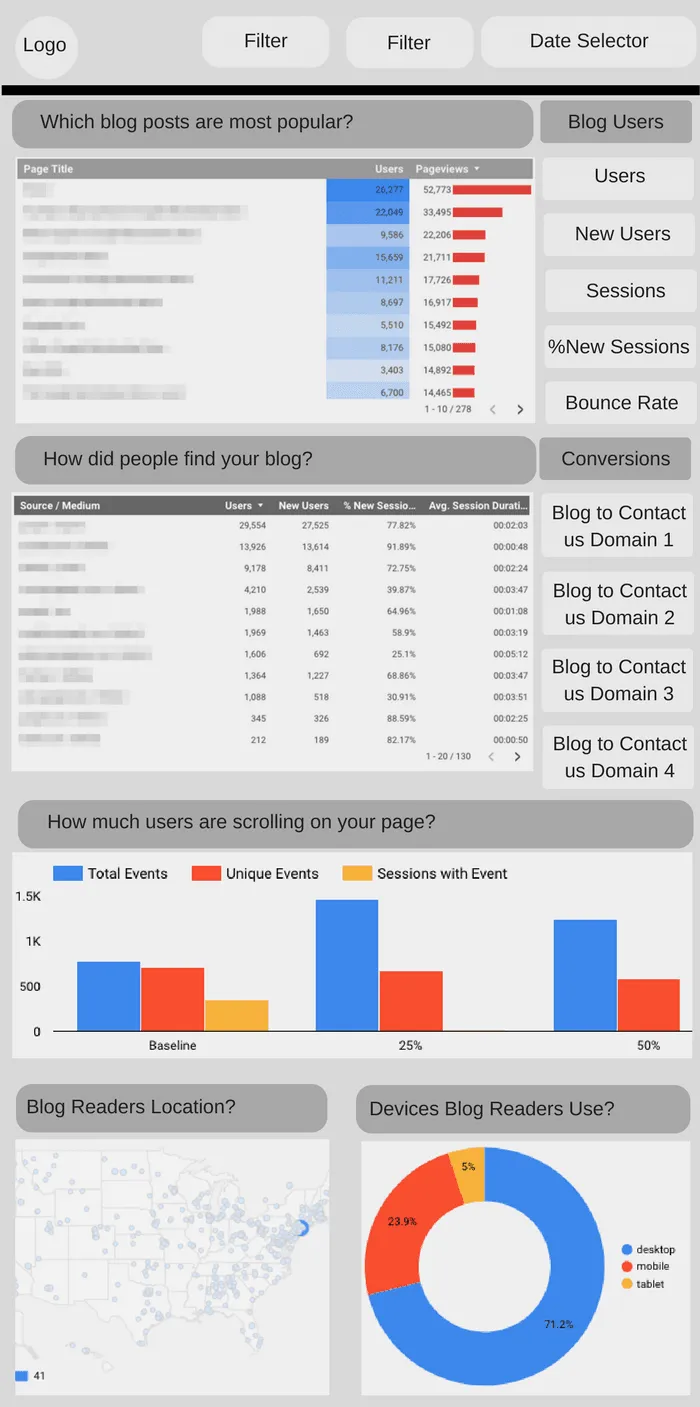
We applied a single filter to all widgets displayed in the afore-posted dashboard, apart from conversions, which were added using sequential segments, created and imported into the report shown.The filter we applied was intended for viewing data specific to blog pages only.
“Working with MarketLytics gave us what we were looking for: confidence. Not only can we now answer the questions we need to answer in our reporting, but throughout the collaboration process Hussain at MarketLytics was patient, knowledgeable, and reassuring.
”
Conclusion
We delivered the report that the content marketing team was eagerly waiting for. They can now easily view the performance of their content and the report also helps them develop engaging content better tuned to generate the most conversions. They have the data they needed and can now focus more on their content marketing process rather than wonder about the inaccurate data they had in analytics.
This process can be applied to any content marketing team who wants to measure their content performance. In a nutshell, having the right analytics team to handle analytics for your website can help you focus more on the things you are good at. If you want us to get this done for you, get in touch with us.