Mixpanel is one of the best tools we can use for tracking events and people. It is a complete toolkit for tracking actions and analyzing those actions to understand the user intent.
In our recent article, we outlined a brief introduction to Mixpanel. It is a good start for anyone thinking of using Mixpanel or using it.
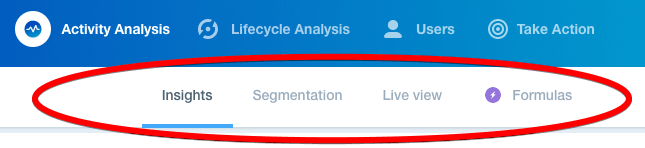
In this article, you are going to learn about Mixpanel activity analysis features that include Insights, Segmentation, Live View, and Formulas. I will be explaining each feature in detail so you would be able to analyze activity.
Insights – Deeply Analyze Users & Actions
Insights is a powerful Mixpanel feature that allows you to answer complex questions. It allows you to visualize your data in multiple ways using different data visualization and functionalities.
Using insights, you can create an advanced report for your marketing team. Using the query builder you can ask complex questions and also compare users and events.
To get into insights, click on the activity analysis drop-down from the top menu and click insights.
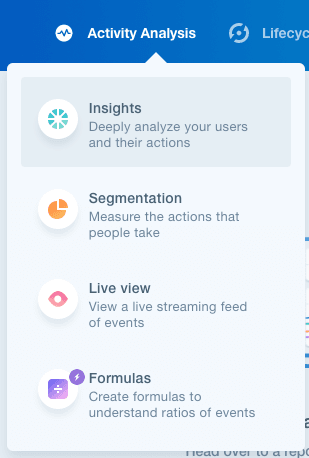
Inside the insights interface, you will see the list of all the events you have captured and a query builder on top.
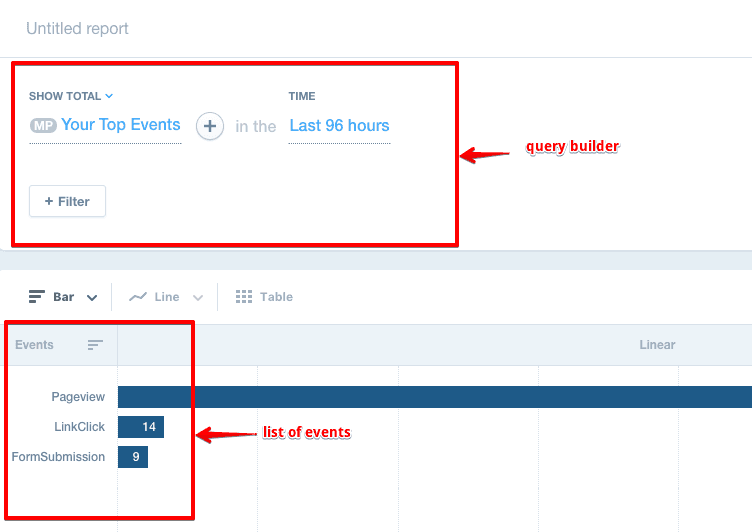
Query builder is the actual tool you will be playing with to dive deeper into users and events. You can use it to ask anything about your users and events. So if you look at the above image, I have currently three events recording pageview, link click and form submission.
I can use the query builder to compare the total number of events vs unique events. Let’s create a report to compare all pageview events vs total pageview events.
Click on ‘your top events’ drop-down and select pageview event
Click the next plus(+) icon and again select the pageview event from the drop-down
From above the second pageview events selected, click on show total drop-down and select unique.
Finally, select the date range to compare the events. By default, it compares with the last 96 hours, but you can change this by clicking on the time drop-down.
This was a very simple way of comparing unique pageview vs total pageviews. Let’s create a more advanced report to understand which devices were used and which pages were mostly viewed within a given date range.
Let’s look at the below animation to create the desired report.
Once you create a report, you can save it to share with your team, add it to the dashboard or download as CSV file.
To understand more about insights, click here.
Segmentation – Measure People’s Action
Segmentation allows you to drill down events by its properties. You can use segments to break down a single event to see how many times it has been performed over a given date range.
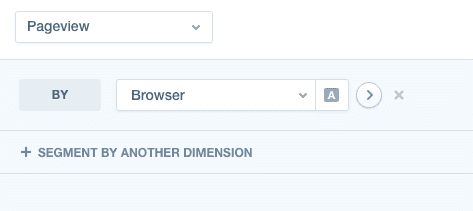
Let’s take our previous example of pageview event to see the number of times pageview event was performed across browsers in each hour.
First, you will have to select the event and break down by browser and filter it by hour.
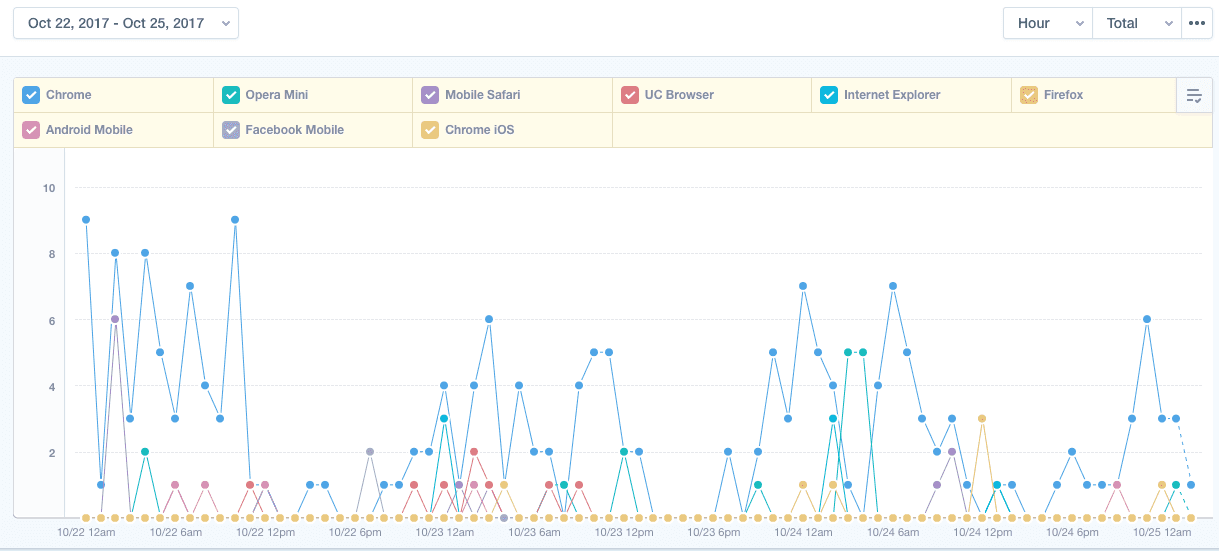
The above image displays the number of times pageview event occurred on each browser by hour.
Let’s create an advanced segment to see the total number of pageview events happened in Pakistan on android devices.
You can then bookmark this segment or add to the report.
The segmentation chart can also be used for comparison. For example, you can compare multiple browsers, cities, countries and any other property that is available.
Let’s select the pageview event and segment by browser.
Scroll down to the chart section and click on the top right button of the chart. From the drop-down select the browsers you want to compare as displayed in the gif below.
Another important feature that is useful in segmentation chart is annotation. This feature helps you add notes to the chart whenever you make any update on your product. For example, you have added a CTA button on November 26, 2017. You can add a note about this change on the chart to see the changes that occur from that day onwards.
To add an annotation, hover over the data point on the graph and click to add the note.

Although, segmentation and Insights look similar but have many differences that make them separate. One of the main difference is in the query builder. Insights allow you to compare multiple events and properties in a single chart. It also contains multiple types of charts to view data from a different point of view.
To understand the difference between insights and segmentation, try to use both the features.
Live View – Live Streaming
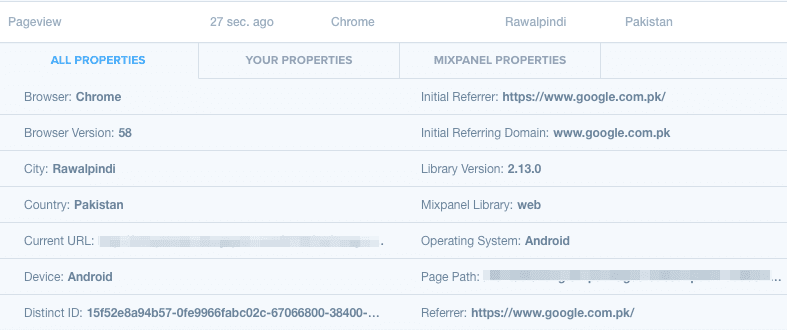
Live view displays the current events being performed on your website. It refreshes every time a new event occurs. It displays the list of events happening on your site along with properties.
You can click on the event to view the properties that is associated with each event. You can view the properties you have assigned and those assigned by Mixpanel.
You can also apply filter the live view report by event and properties. To do this, click on the filter icon on the top left of the report and select the event/property.
Click on the add button to apply the filter. Once you apply this filter you will not see any data you have filtered out in real-time reports.
The activity analysis feature empowers you to dive deeper into user actions and understand how a user interacts with your website. In the next article, we will be discussing Mixpanel libraries and people tracking, make sure to follow us on Twitter or signup to our newsletter to read first.