Introduction
Displaying information containing text data has always been a challenge, but that can be beaten by word clouds – a favorite to visualize textual data for years as its an all-in-one viz. A word cloud (or tag cloud) is a visual representation of text data, it contains metadata about a text field like the frequency of a word; the more frequently a word appears in the data, the larger it is going to be displayed in a word cloud. They are simple, visually aesthetic, fun to use and communicate results very conveniently to users.
Community Visualization in Looker Studio
This awesome viz is available in Looker Studio and this visualization was created using the newly introduced custom visualization feature in Looker Studio. More details of it can be found here.
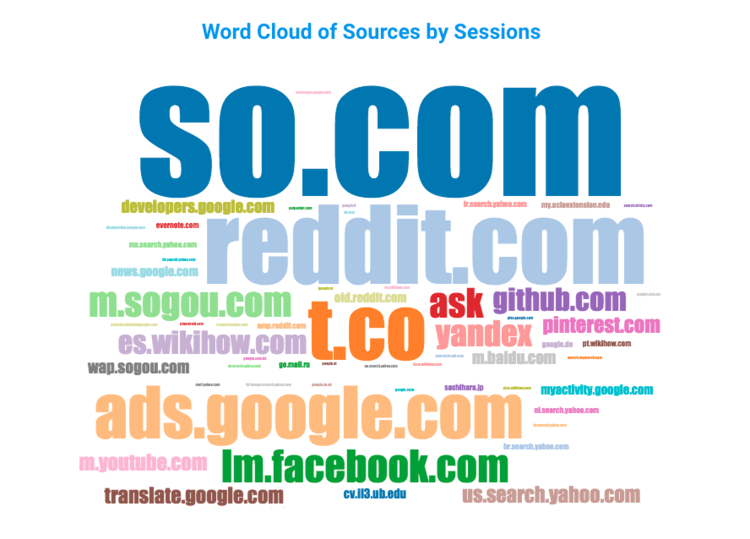
Using the same feature a word cloud was created of popular sources by sessions using the Google Merchandise Store Data. It is built on d3.js getting the top 250 popular sources that can be explored in the word cloud in this report.

Data Requirement: This graph takes a dimension preferably text which contains text and a metric to measure the frequency of the dimension.
Try It Out!
You can add this word cloud in your own Looker Studio Report and play with it, to do that here is a step-by-step guide:
- Step #1 – Make a new Blank Looker Studio Report
- Step #2 – Add your Data Source to it
- Step #3 – Enable Owners Credentials and the Community Visualization Access

- Step #4 – Add a Community Visualization Chart and add the link and Component ID wordCloud

- Step #5 – Add your desired text dimension and metric that you want to do the analysis for.

- Step #6 – Here you go! Your own word cloud is ready!


Why Word Clouds?
Word clouds are very easy to understand and informative, trends and patterns in the data can easily be identified just by looking at prominent words in the word cloud. For instance; the sentiment analysis of product reviews, can easily find out if customers were happy or unsatisfied with a product just by checking if the highlighted words in word cloud represents a negative or positive sentiment.
Things to keep in mind
Word clouds can be fun and informative but they still need a lot of work to provide the right results. The most important step before using any data to communicate results is to clean up that data. Same is the case for using textual data before using it in the word cloud. Applying a number of Text Mining techniques to clean up the clutter, can make word clouds more informative.
Removing Stop Words
There may be words in the data which appear frequently but carry no meaning or information on their own, such words are known as Stop Words. Some of the common stop words can be: the, is, are, at, you, etc. These words are usually a part of the common list of stop words in most of the NLP libraries. However, a personalized list of stop words can be made to include words that have no value in a specific scenario, but may be important for others.
Stemming
Stemming is a popular NLP technique that involves removing the end of words to get only the root of the words. This can be really helpful to declutter the text mining data when one single word is being frequently used in different ways. For example, a popular list of words may contain lag, lagged and lagging. Using a stemming algorithm on such words will reduce them to lag and sum up their frequencies. This will give more accurate information and will make room for more highlighted words in the data.


