Data analytics has pretty much come forward as a multipurpose gaming arena in the new times. It’s no longer restricted to only taking care of the e-commerce side of things, but also extends a helping hand to the content and marketing dimensions. But this is where things get a little jazzy. When you have a site that is primarily focused on content, figuring out how it is performing, can be, well, somewhat trickier than usual. That is because, with a content-heavy site, the objectives are not as clearly defined as compared to a typical e-commerce website, where the main goal is to get users to purchase.
So then, how do you get the most out of data analytics to improve your content driven website? Read right on! Because I’m going to be sharing the 8 most important tracking parameters that will help you significantly improve your content, tell you where to focus your effort, and skyrocket your engagement.
Scroll Tracking
Let’s begin with a simple question “are people even reading your content?”. Go ahead and answer it.
“How about sure? Look at all these page views!” now before you say something like this, consider this, do you really know if people are reading the entire articles? Or do they go looking for another piece after the first couple of paragraphs?
Knowing if people are finding your content interesting and helpful enough to read is important because think about it, whether you’re writing your own articles, or you’ve hired a cool new dudette to create the awesome pieces, or you’re outsourcing your work to these incredible agencies, you’re using resources! And you need to be able to measure if this time and effort are paying off.
So how do we get a feel of how much our content is keeping users interested from beginning to end?
Brilliant question! And the winner is….’Scroll Tracking!’
Scroll tracking gives you direct access to how much user-activity actually happened on your page. Once you have the scroll numbers you can break down the user behavior by articles, author & topics to see how much depth different items are bringing. You can then use this information to focus your efforts on the ideas that seem to be working best!
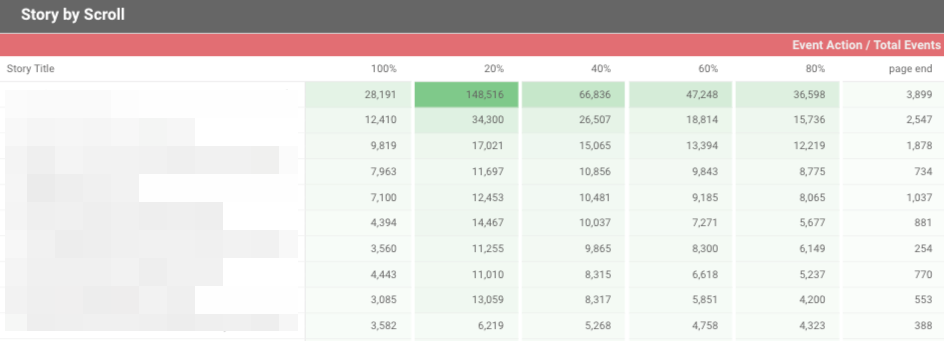 An example of scroll tracking data
Here’s a detailed walkthrough we did on how to set up scroll tracking with Google Tag Manager, in case you want to check it out.
Engagement Time
Scroll tracking is awesome. But sometimes, it isn’t the most accurate parameter to measure content performance, at least on its own.
But you raved about it above for four entire paragraphs! You might exclaim.
Let me explain.
Suppose a visitor lands on one of your lovingly crafted articles and spends the first couple of seconds scrolling from top to bottom searching for some specific information. Once they find what they were looking for, they slow down, and scroll slowly, reading very carefully. Once they are done reading what they wanted to, they then open another tab in the browser and off they are, searching for something else.
What does that mean? That means that the actual engagement time for this particular user was the time they spent actually reading stuff on your site. How useful will it be to track the scrolling here? Not much. But couple that with another parameter called Engagement Time, and you’re golden!
Engagement time is a key feature alongside scroll tracking to get the complete picture of your user behavior. Scroll numbers may sometimes not really be very reliable. But that all depends on how realistic the scroll is and if the user actually read the article while he scrolled down the page. This is where engagement timer comes in. When paired with scroll numbers engagement timer tells you how much time the user actually spend reading the article, how realistic the user activity was and how far did the user go towards the article completion line.

In the GIF example above, you can see how a user spends most of their user session simply scrolling through the article before finally finding what they were looking for. They are only properly engaged with the content for a tiny fraction of their entire user session. In fact, it actually seems like they are looking for some specific information. In situations like this, a parameter like engagement time would help me understand the user activity way better than scroll tracking alone.
Form Submission
The good old forms!
Form submissions may not look like that big of a deal from the audience side, but to you, as the website owner, they represent a humongous leap in the visitor journey, playing a vital role in measuring user conversions and the overall content performance of your website.
Think about it, something in your website, maybe an article, or a tutorial, or even an infographic, convinced this guy to want to make things official with your site by signing up for your newsletter. What was it?
This is where form tracking makes her grand appearance. (Mind you though, newsletters aren’t the only kinds of forms out there. They can be anything a user interacts with, from a sign-up, a comment, feedback, to filling an actual survey form. All these types are designed to analyze a different aspect of user behavior.)
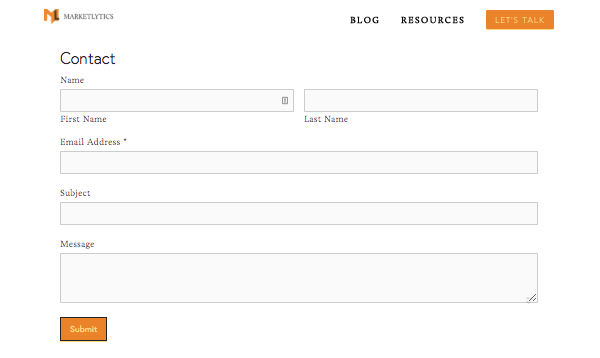 Here’s an example of a form from our own website
Form submission tracking doesn’t necessarily stop at how many people submitted a form. It actually takes things one step further and allows you to analyze all the interactions on your site that lead to those form submissions in the first place, you can find what’s really working well for you and what isn’t.
You can then use this analysis to make informed decisions as to what content is most relevant to your visitors and to go ahead with it.
Affiliate Tracking
Ever heard of affiliate marketing? It’s one of the most popular ways to earn money these days. If you own a blog or a website that primarily features written content or articles, you’re likely not selling anything on it. But if your website brings in a good amount of traffic to it, you can make a hefty sum of money by adding affiliate links to your site and tracking them.
And what are affiliate links?
Affiliate links are links to sales pages that belong to other people’s products but they have your affiliate ID attached. So, when someone from your site gets directed to their sales page and ends up buying something through that link, it earns you a certain, let’s say, commission amount.
When managed properly, affiliate marketing can generate a good secondary income. What better way to monetize your website and cash on your content performance! However successful execution of affiliate marketing is a tad bit difficult when not backed by proper data and analytics.
Affiliate tracking helps you analyze exactly how users are interacting with your links and what they are clicking on the most. It can help you find which links are the most profitable and lead to the most number of conversions.
Another interesting thing affiliate marketing can help you find out is what pages lead to the most affiliate sales so you can optimize them for revenue to maximize your earnings.

Internal Clicks & Promotions
Clicks are important.
But important enough to be tracked?
I’ll tell you how. Keep reading.
When it comes to understanding your audience’s behavior on your site, you can’t get more granular than tracking clicks.
Now I know looking at the big picture is important and everything, but sometimes, you just need to get down to the very basics to figure out what really works with your audience and what doesn’t.
To understand this better, let’s do a crazy little exercise. Ready? Let’s do this.
Go ahead and open a new tab in your browser and search for something. Anything really, it doesn’t matter. Let’s say you searched for “vanilla flavored donuts.” We good so far? Now, click on one of the top results and follow the link to the corresponding website.
Once you’re there, look around. You’re a consumer on this site. Follow what catches your eye, explore the site. Pay attention to what you click and how you navigate. Do you want to buy anything? Sign up for a newsletter? Watch a video on the site? Notice what kind of content leads you to these conversions (if they lead you to these conversions)
And that, my friend, is exactly what click tracking is all about. Clicks are important to understand how your users interact with your site so you can optimize your implementation accordingly for maximum benefits. You can use the information from click tracking to design user flows, improve user experience and ultimately, to construct the overall user journey that would best benefit you.
The same holds true for impressions on ads and banners. This allows you to combine this data with other metrics so you’re able to better optimize the ads you place on your site. Here’s a quick nifty guide to track your banner impressions, in case you’re interested in implementing it.
Site Search Tracking
Do you have the site search functionality enabled? It helps people search your site for content they specifically want to see. Tracking how people use this search box, can give you some super valuable insights! How? Well here’s how.
Search analysis is designed to understand what a user is looking for, how good the search results are and if there topics that your users are interested in, that you haven’t yet written about and probably should.
Here are a few examples of the kind of data that site search tracking can give you;
-
Your start pages, ie, the pages that visitors started their search on your website from
-
The ‘search terms’ that your users enter in to look for specific content on your website
-
How successful the site search results have been so far in driving user engagement, sales, and conversions.
Social Share Tracking
So! Here’s a fun question. On a scale of one to unconditionally, how much do you love scrolling through and sharing your favorite things on your social media profiles?
Let me tell you the answer without hearing you say it out loud. A lot! Right? Which is exactly why you need to track your social shares!
Social media is so much more than sharing pictures of your cat now. It has emerged as the new word-of-mouth, and blown it up into one of the most rewarding free traffic drivers and one of the most accurate indicators of measuring content performance these days!
In recent months, however, there have been slight changes in the LinkedIn, Twitter, and Google+ APIs to remove the social share counter. So now is there no way of knowing what content people are sharing and on what channels?
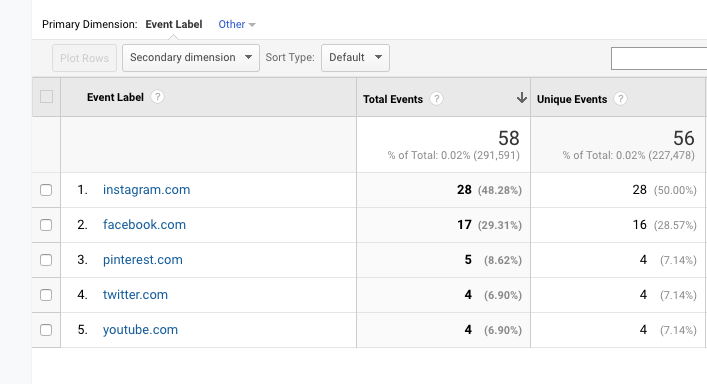
There is! With social share tracking of course!
Social share tracking is one of the most resourceful ways of bringing back engagement to your site by giving you a realistic feel of what’s popular with your users and what they absolutely love sharing.
Video Engagement Tracking
Let’s say that you’ve suddenly realized the importance of video in promoting your content and you’ve started making tons of videos. But here’s the question you’ve been putting off. “Are people even watching your videos?”
But of course, they are watching your videos, because you’re brilliant and your videos are great but are they relevant to your audience? Do they leave off in the middle? Watch only the first couple of minutes? Or actually, reach the finish line? Which video convinced them to like, dislike, or share it?
This information could greatly help you create high-quality, engaging, video content that will keep your audience hooked until the very end.
Well, that’s all cool, Jhone, but how do I answer all these jazzy questions? I know that’s what you’re wondering.
Behold, the video engagement tracking. The concept of this is similar to scroll tracking that we covered further up the article. It gives you very granular details of how your users engage with your video content. Here are a few examples of what video engagement tracking can tell you:
-
What % of the video was watched, for example, 25%, 50%, 75%, 100%
-
When the video was paused
-
At what point in the video did the user leave
-
A like, dislike, share or comment on your video
Conclusion
Now that you know all the top ways to accurately measure your content performance, I highly recommend that you put together a spreadsheet to keep track of all this data.
To conclude things, there are no real ‘goal values’ here that you can aim for. The internet changes constantly and what may seem like a great strategy today, might not be fit to work on tomorrow.
The best you can do is keep a close look on these metrics and dimensions and keep optimizing your content to deliver the most value and be most relevant to your audience in order to boost your engagement rates.
In my next article, I will be discussing how to implement some of these items using Google Tag Manager and will mainly focus on the one-page site so stay tuned. In the meantime, here’s an awesome article on how to boost your content strategy using Google Analytics.