Google Analytics gives us heaps of data, which is often very difficult to handle. Especially if you are working in content marketing and promoting, it’s hard to tell if you are making a dent. Pageviews is always a quick shot but when most browser windows look like this;

so many tabs.. so little time...
It’s hard to know if people actually engage with the content? Did they read it? Or was all your content marketing strategy for naught?
Short of sitting with every user as they give your post a read. We use a few proxies for estimating engagement. One of the easiest to use and understand is scroll tracking. This is where we consider people scrolling down a page to estimate engagement.
Why to use scroll tracking to measure content engagement?
Broadly scroll tracking gives us a trove of data to answer a few questions every (serious) content writer and marketer has wondered about.
-
Understand where people drop-off?
-
Why do they drop-off? Is it because content is too long?
-
See where to place key call to actions? If people only read 50% of page adding CTA in footer is losing you a potential audience
-
See what type of content resonates with your audience? Do certain topics keep users more engaged than others?
Google Analytics Scroll Tracking to Measure Content Engagement
google analytics scroll tracking
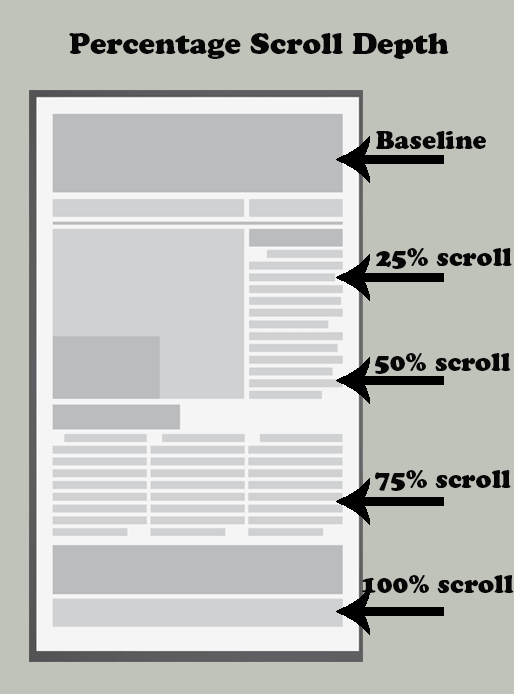
As the name suggests, we track how many people scroll through the page and the time they spend on it. It does this by sending data to google analytics after every 25% of the page scroll as well as time it took for the user to get to that point.
Before we begin: Setup scroll tracking
Easiest way to setup scroll tracking on your site is to make use of Google Tag Manager (GTM) Custom HTML tag. I recommend this great bit of code to implement it. With this can also track when specific elements on the page are scrolled into view.
Understanding engagement and what is available
Once scroll tracking is set up, the real fun begins! We can now use custom report to understand data generated by scroll tracking.
To do this, I use Scroll Tracking Report. It contains page title as the main dimension along with total and unique event to show count for number of time page scrolled.
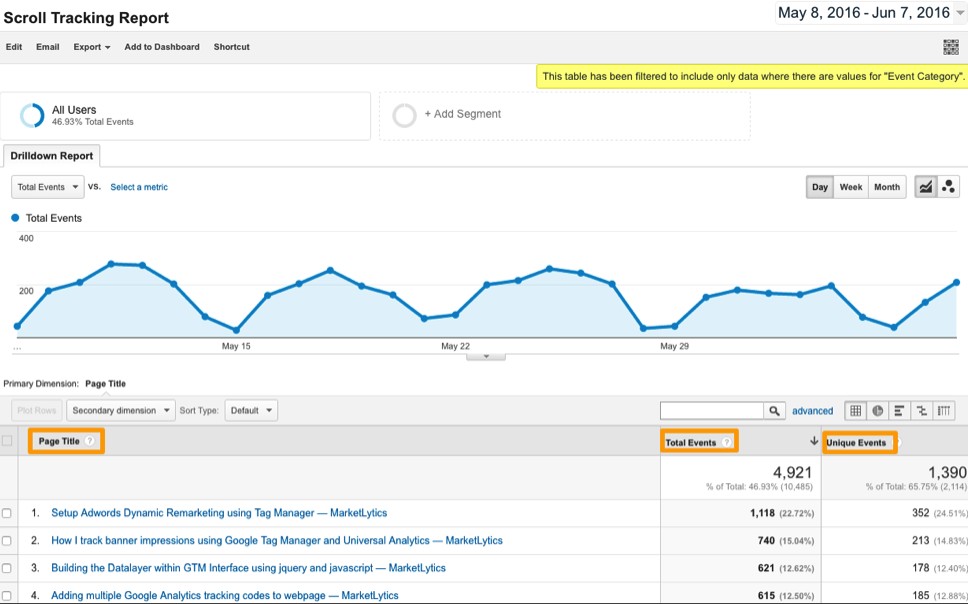
This is a drill down report which means you can click through page links to further explore data for particular pages.
Once you click on any page title, the report will modify report to show scroll distances detail for that particular page.

Above you can see different scroll events for particular page along with how often people are getting to that point.
Understand Time spent on the page
Using the scroll tracking data we can also see how much time users are spending on individual content pages. For that, you will need to create scroll tracking timing report. This report works similarly to above but shows how much time people spend getting to each step.
10 Questions to Ask About Your Content Marketing Strategy
All the setup and custom reports are good. But they are really only as useful as the intelligent insights you can glean from them. Here are a few talking points to get started.
-
What marketing channels and audiences are more engaged?
What segment of traffic spends the most amount of time? -
What type of user are converting. Are people who read more than 75% of the blog converting more than other user on site?
-
Your blog article has video other interactive content in the beginning of the blog. Are users reading down the blog or just watching the video and leaving?
-
See where to place key call to actions? If people only read 50% of page adding CTA in footer is losing you a potential audience.
-
See what type of content resonates with your audience? Do certain topics keep users more engaged than others?
-
Determine what authors receive highest value of scrolls. What writing styles interest your reader the most?
-
Measure user engagement with specific sections. Are they more engaged with a specific paragraph, video or activity?
-
See where users usually drop-off on individual blog post.
This may indicate issue with a certain topic or article or tell you a common trend about length of content. -
Read the content, see what were potential areas that might have led to user losing interest and leaving. Is the content too long ? Does my writing need some uplift ? or maybe article is simply dry and you need to add pictures and multimedia at these levels to keep user engaged.
-
What time of the day does your user spend most time on content pages. Publishing your articles and promoting them during these hours can result in overall increase of your reader base.
Thank you for reading, I hope you find this helpful and makes your google analytics data a little more useful in improving your content marketing strategies. As always these are just some helpful starting points and you should adapt and extend it to your needs. Would love to hear your insights on how you make your content marketing efforts data driven!
PS. If you’re growing your content site, check out this article about the top 8 ways to understand what works!
