SUPERWEEK. Leaders of measurement industry at one place!
Last week my colleague at MarketLytics Hussain attended the 5 day SUPERWEEK conference held atop a beautiful mountain in Hungary. The conference is considered to be the annual meetup of Digital Marketing professionals and leaders of the Measurement industry who have been working on innovative solutions.
I have always wanted to attend one of these conferences where you get a chance to meet with the top creatives around the globe, learn from them and expand your knowledge. I’m hoping that day will just drop randomly into my lap one fine morning 😀
But while we wait, here’s something productive I did to counter my anxiety. I collected 2400 tweets from the Superweek official twitter page. This blog post (also scratched out promptly to overcome said anxiety) explains the findings of my analysis on the Superweek Tweets.
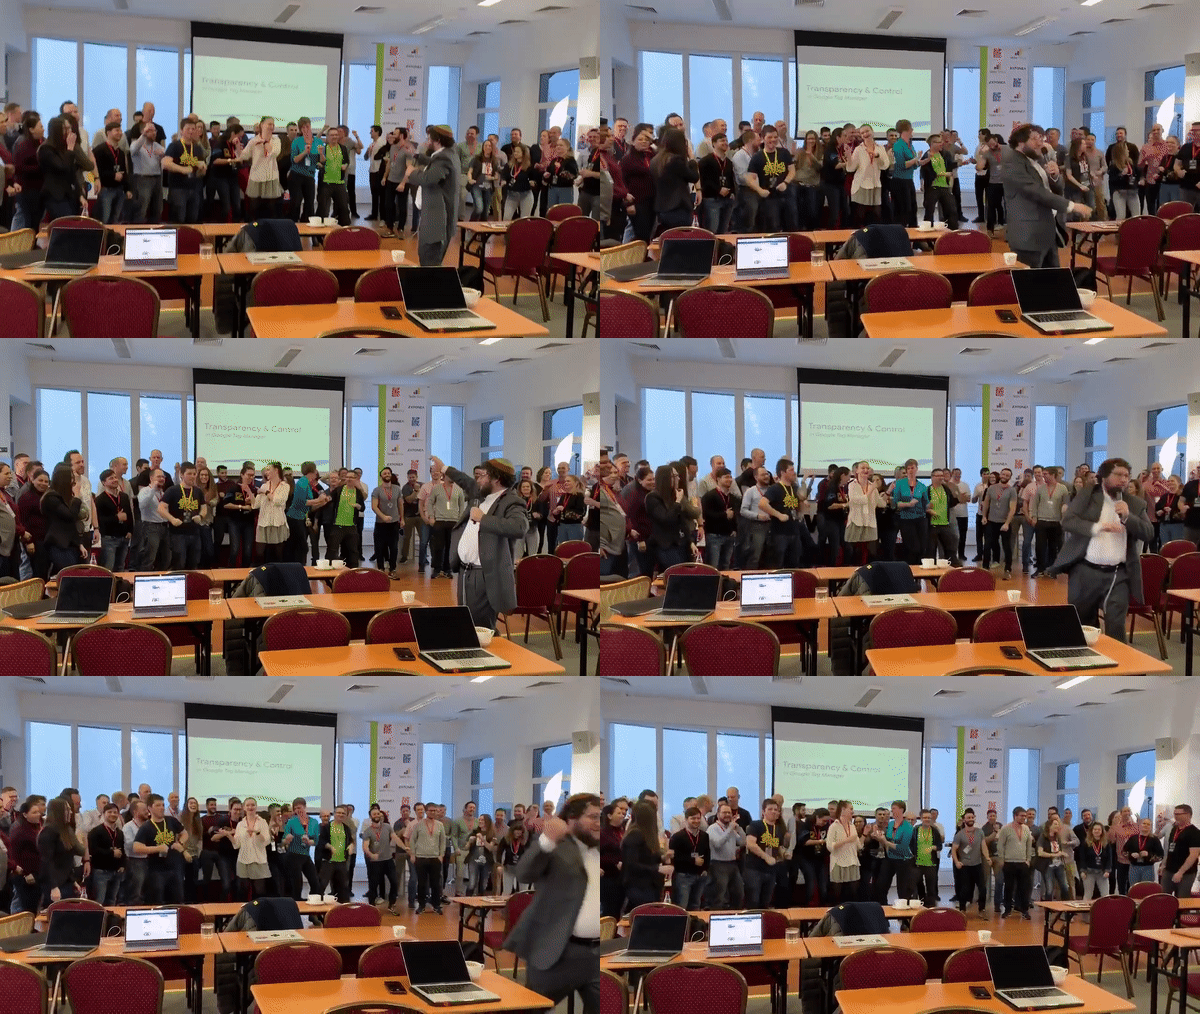 P.S Seems like yeh-hoh-SHU-ah@AnalyticsNinja has won the Golden Punch card 😀 though he has not actually won it, he is such a great host.
(Golden Punch card is awarded annually to the most innovative solution as voted by the conference participants)
Scroll down to see the winners for Golden Punch card...!
Data Ingestion:
I used the Tweepy, python library for accessing twitter API, to collect 2400 tweets from Superweek`s official twitter page under the screen name of @supervveek and stored them in a NOSQL database (MongoDB). After getting the tweets into MongoDB, I used this awesome tool *points to exploratory.io* to analyze tweets because it encapsulates many complexities as mentioned by Tim wilson in his tweet as well.
SUPER intrigued by @hu_me 's use of https://t.co/ZHKBSrFXzY at #SPWD: a visual interface to R that seems like it surfaces a ton of the power of #rstats without the learning curve of all the coding (although supports coding customizations).
— Tim Wilson (@tgwilson) January 30, 2019
It’s important to note that all tweets were collected from Superweek`s twitter page and the analysis is focused on tweets ranging from 2019-01-27 to 2019-02-02 (one day before and after the conference are included).
Exploratory Data Analysis Questions:
After the data ingestion phase, I started to brainstorm questions that can be answered,
-
What is the Tweets and Retweets Frequency (by Day and Hour)
-
What are the top Words and Top Hashtags
-
What is the average Sentiment of Tweets (by tweets)
-
What are the top mentioned participants and Average Mentions (by Day)
-
What are the top participants (by number of followers)
-
What are the top Origin locations (by retweeting participants)
-
What are the top 5 tweets (by retweets)
PS: I am not a Data Scientist, but I will try my best to answer these questions
PPS: Hit ‘See more details’ to look at these charts in greater detail
Tweets and Retweets Frequency (By Day and Hour)
The above chart above shows the tweet frequency by day. Wednesday January 30th, 2019 with 19 tweets and 48 retweets seems to be popular day in 5 day Superweek.
The above chart shows the total tweets and total retweets by the hour. 10 am appears to be the busiest hour among all the days with a tweet frequency of 14 and 11 am appears to be the busiest hour among all days with a retweet frequency of 50.
Top Words and Top Hashtags From Tweets posted by @supervveek

The above chart shows the top words among all tweets having a frequency greater than 1.
Supervveek, spwk, simoahava, ashlindly, danielwaisberg are among the top 5 words.
P.S Simoahava and Danielwaisberg seems to be happy for being so popular 😀
The bar chart above shows the top hashtags among all tweets having a frequency greater than 1.
SPWK, spwk, supervvek, measure and superweek are among the top hashtags. It is interesting to see googleanalytics, googletagmanager and R among the hashtags too.
Average Sentiment of Tweets By Day
The above chart shows the average sentiment score by tweet text. The sentiment for each tweet was calculated using the get_sentiment() function in exploratory.io.
It is interesting to note that the Superweek started with an average sentiment score of 0.39 on the 28th of January, went to 3.1 on the 30th of January, came down to 0.44 on the 31st of January and again went up to 1.63 on the 2nd of February. Folks seems to have had a positive sentiment throughout the conference.
Top Mentioned Participants & Average Mentions By Day
The above chart shows the top mentioned participants who have been mentioned in tweets more than once in 7 days. Simo Ahava, Daniel Wasiberg, Mark Edmondson, Ashley Lindley and Stephen Hamel appear to be the top 5 mentioned users (excluding SUPERWEEK)
The chart above shows the average mentions by day. 30th January, Wednesday seems to be the day with the most mentions.
Top participants (By follower count)
The above chart shows top participants by their follower count. Avinash Kaushik with a follower count of 1,88,924 appears to be the top participant.
Top Origin locations (By Retweeting Participants)
The above chart shows top origin locations by participants who retweeted. London, Canada, Copenhagen , Dublin and Seattle appear to be among the top origin locations by retweeting participants.
Top 10 Tweets By Retweets
The above chart shows the top tweet which has been retweeted more than 10 times. Simo Ahava`s tweet seems to be the top tweet by retweet.
Conclusion:
All in all, collecting tweets and using them to answer questions has been a great learning experience. (For those who are wondering if it helped with the anxiety, yes it did 😀 )
I would particularly like to ‘shout-out’ style mention an awesome tool, exploratory.io. This smart little tool here makes data analysis and data science activities just so much more accessible to everyone.
From Data Wrangling to data analysis and applying a variety of statistical techniques, It has everything in it. I made separate dataframes out of the original tweet data for each question I answered above and defined a recipe (collection of steps) to get to the answer.
Golden Punch card winners of Super Week 2019 are:
-
Gold: Zorin Radovančević
-
Silver: Erik Driessen
-
Bronze: Steen and Mark
