This blog is now deprecated, read the updated blog here
Google Analytics events flow visualizes the order in which the events are triggered by users on your website. Events in Google Analytics are any actions like button click, video play or pdf download.
Event flow reports display how users are interacting with your website. To view this report, you have to implement event tracking in Google Analytics.
How to Access Event Flow
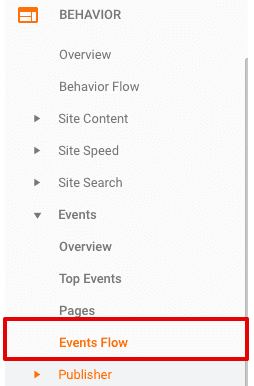
To access event flow in Google Analytics, navigate to Behavior >> Events >> Event Flow.
How to Use Events Flow Report
Once you access the events flow report, you can change the level of details to only see the category or category/action for events. To do this, click on the level of details button on the top navigation bar.
Event flow report consists of nodes, connections, and exits. By clicking on the node, you can highlight traffic from a specific node. By highlighting a specific event, you can see the flow of a specific event.
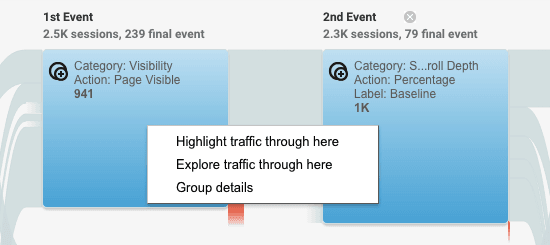
By selecting explore traffic from here, you can actually build events funnels to see the order in which a specific action is carried out.
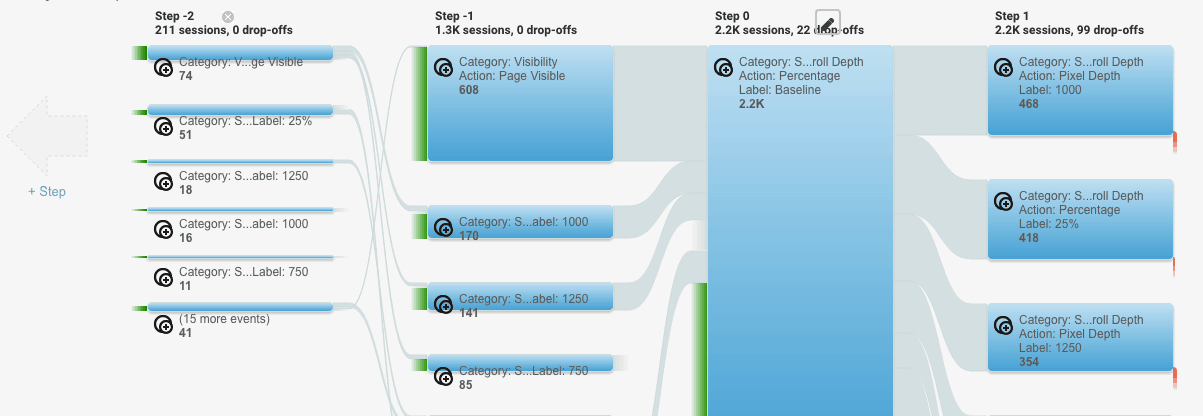
Clicking on the country drop-down, you can change the dimension for the report. You can change it to see on which browsers the events are being completed.
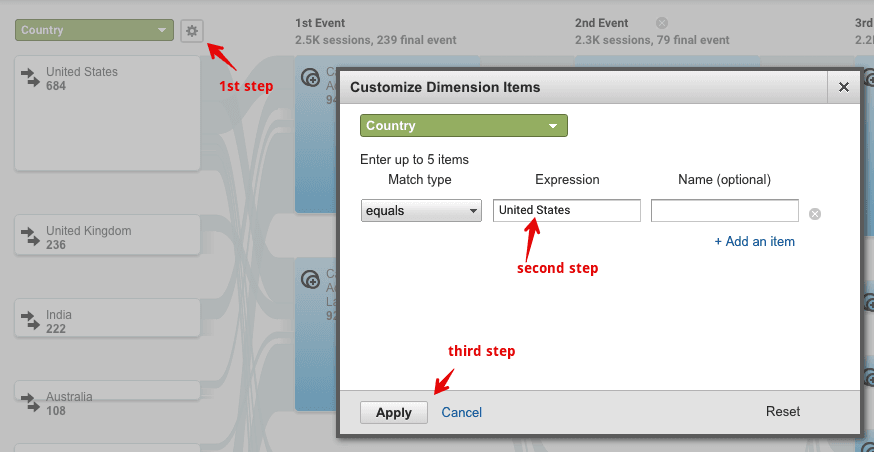
To check the event flow for a specific event, click on the settings icon, specify the dimension and apply the condition. For example, to view the event flow for a specific country, we can enter the country name in expression field.
What we can do with Events flow report
By using the events flow report, we can:
- Verify if exists a certain event that triggers first and if leads to more events
- Verify if an event is triggering multiple times in a single session
- Figure out the most popular event
- Apply segments to measure if certain category of visitors are completing more events
By using this report, you would be able to measure if a group of events are conducted in series or not. We can take example of scroll tracking to see if the users are following the events from start reading the article to finish the article.


