What are Custom (Explore) Reports?
Custom reports in google analytics are the reports that you create. You can do this by selecting the required dimensions and metrics and view them the way you want.
How to Create Custom Reports in Google Analytics?
Follow the steps below to create custom reports in google analytics.
Step#1: Login to your analytics account.
Step#2: Select the ‘Explore’ tab from the side menu.

Step#3: Click on the ‘Blank’ report.

Step#4: Enter the exploration name (title) for your custom report.
Step#5: Select the report type, import dimensions and metrics.
Step#6: Drag the dimensions to rows section and metrics to values section
Step#7: Filters are optional but this is added to restrict the data for specific dimensions.
Step#8: Select date from drop down
your report will look like this
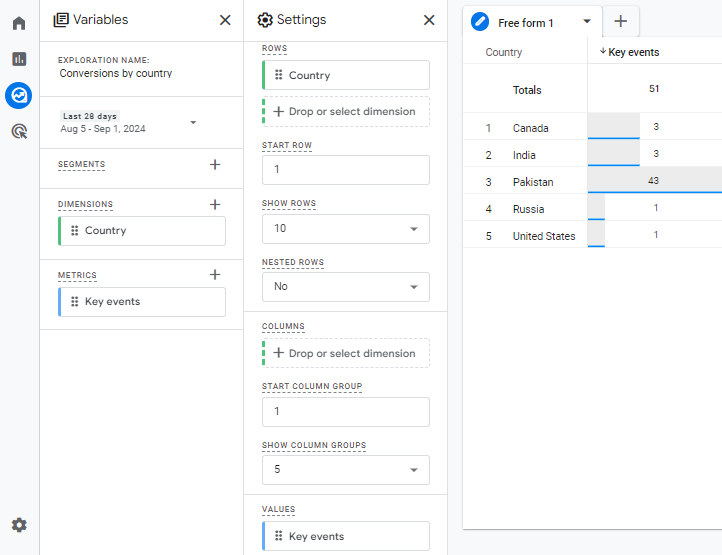
The report will be saved in the Exploration tab. You can edit/rename it anytime and share it with anyone you want.
For more google analytics tutorials and latest trends about digital analytics please follow us on Twitter.