Google analytics is a perfect tool for analyzing website traffic and performance. You might have a big online ecommerce business and getting millions of visitors monthly.
You would be glad to know that google analytics does show the most busiest days and the peak hours of your online business. It can display which days your website has the most traffic and the peak hours for that specific day, during which most sales occurred or most visitors visited.
View the most Busiest Days
To view the most busiest days, first choose the date range and then navigate to Audience >> Overview. On the graph click on the day button to view daily traffic.
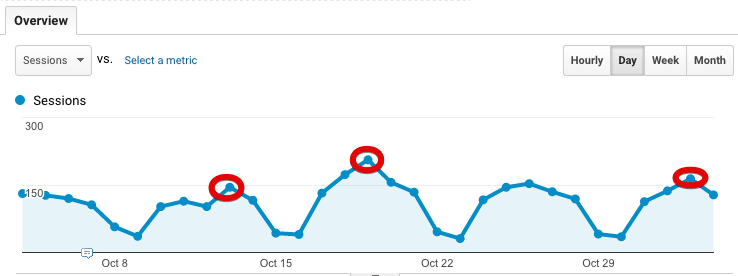 audience report by day
View the Peak Hours
To view the peak hours, from the above reports click the hourly button.
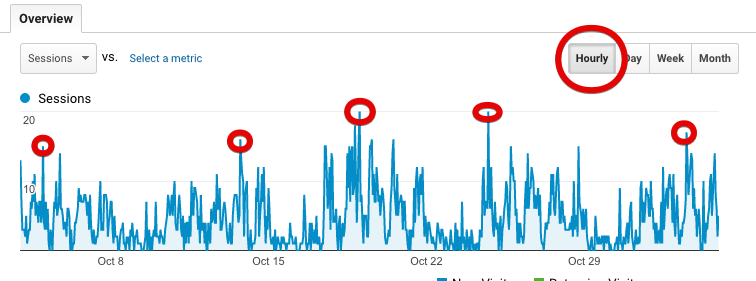 audience report by hour

The second option to get the reports in table form is to create a custom report like the one below.
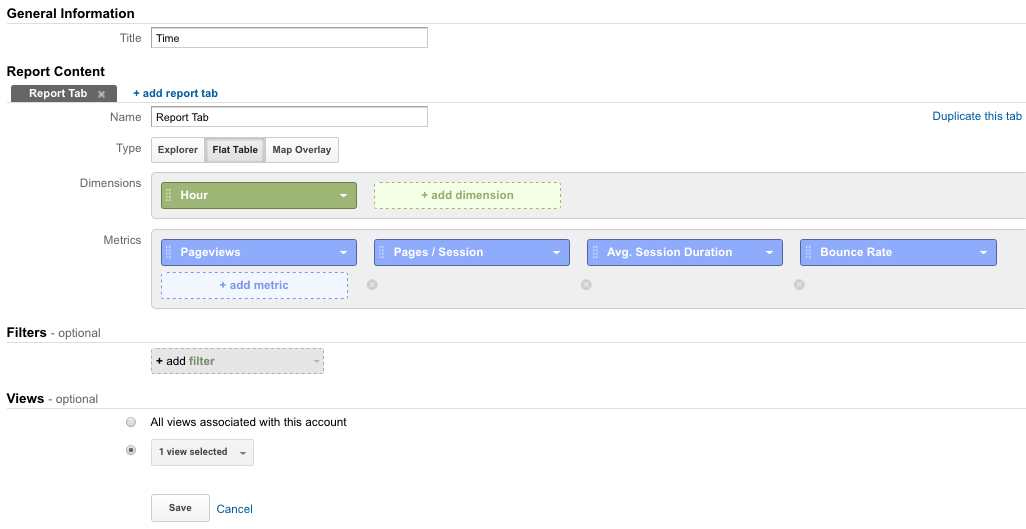 custom reports for day and hour
