This is the third article from our Looker Studio series. In our first article, we have covered a comprehensive Looker Studio tutorial. In the second article, we published a marketing and SEO template for all kind of online marketers. Now, we are giving away our top Looker Studio ecommerce template.
If you want to learn Looker Studio or get our marketing template, please use the links below:
Get our Free Looker Studio Ecommerce Template
Click on the button below to view and copy our ecommerce template. Below we have mentioned a step by step guide to get you started.
How to copy ecommerce template?
To copy the ecommerce template, follow the steps below:
1. Click on the copy icon and please do not request access

2. Add your Google Analytics view which contains ecommerce reports or simply add Google Analytics demo account
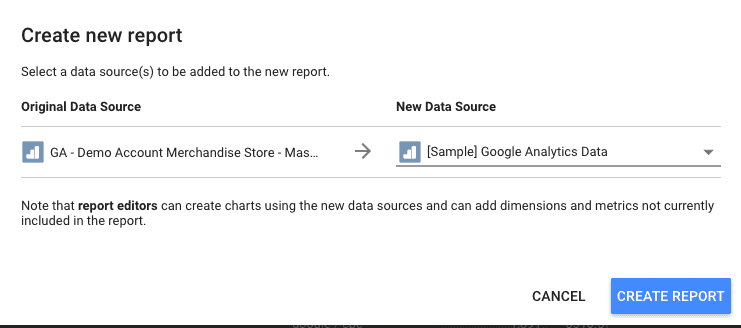
Click on the create report button and select follow a few steps ahead.
How to Read the Report and What’s Included?
As the template contains multiple reports and it would be difficult to read for less technical people. Below I have explained each of the report included in this template.
Top Ecommerce Metrics at a Glance

Being an ecommerce retailer, you would want to look at the most important metrics related to your online store. To help you look at the important KPIs, the top overview bar is very helpful.
New vs Returning Customers
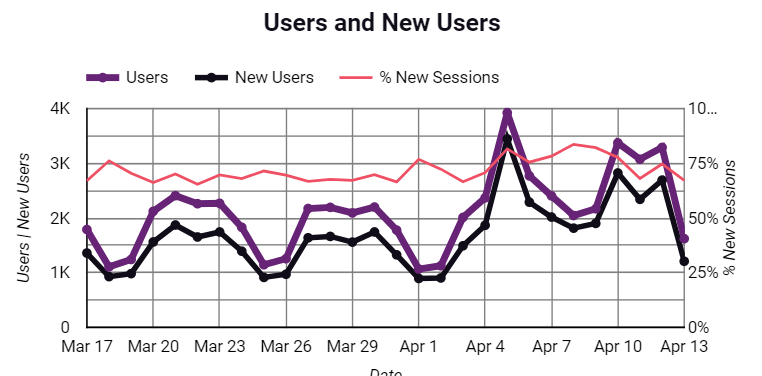
This report helps in understanding the behavior of new vs returning visitors. You can see if you have more returning visitors or new visitors and which group have the highest sessions.
Which source/medium generates more revenue?
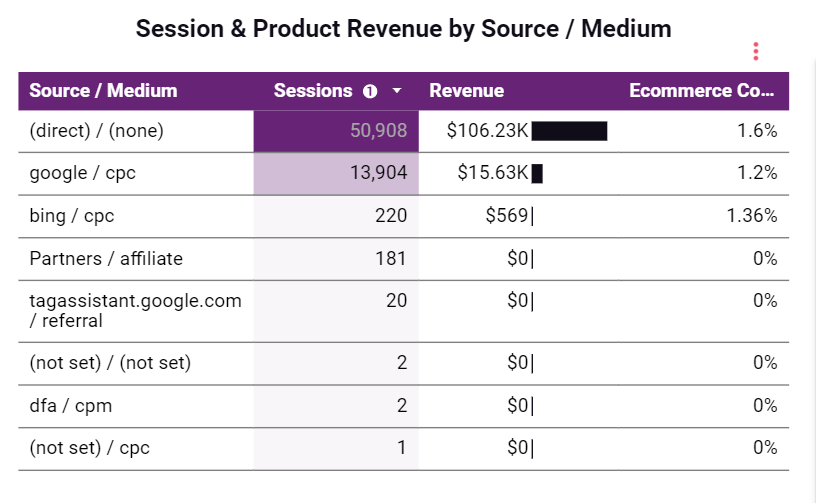
If you are promoting your product on different platforms, then you will definitely want to see which source is generating more revenue. As you can see in the above image, the largest revenue is coming from Google so you will concentrate more on Google rather than any other source.
What is the most popular product on my store?
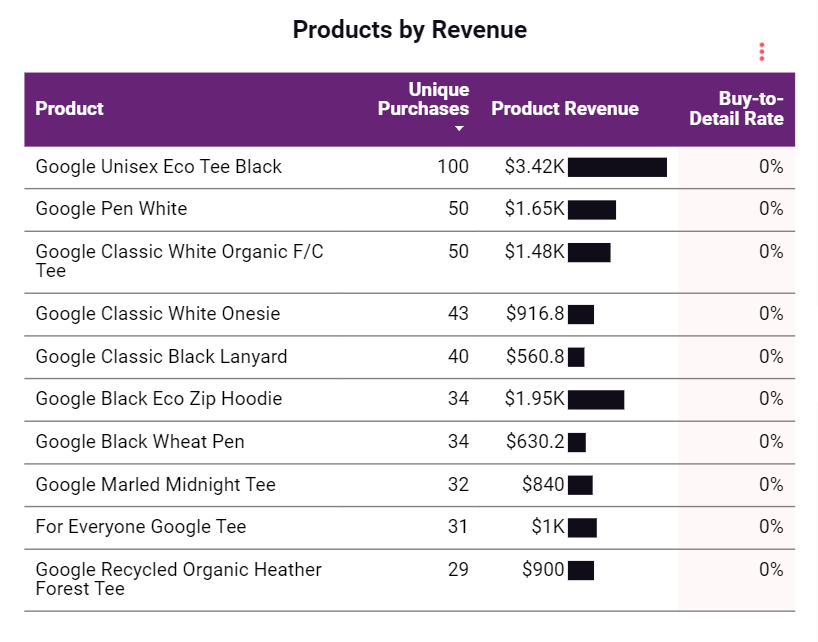
This report displays the top revenue generating products. Click on the dimension or any of the metrics to sort them in ascending or descending order.
How do users navigate through the checkout funnel?
The checkout funnel in this template is really out of the box. You can see the number of people dropping off at each checkout step. This funnel has been built using the calculated metrics and this isn’t available by default in Looker Studio.
Use this funnel wisely to understand why people drop off and what could be done to improve the conversion rate.

The above image shows the calculated metrics that we created for this report. Below are the formulas for the above metrics. Please add them after you copy this tempalte
- Product List Views Drop % = (Product List Views – Product List Clicks) / Product List Views
- Product List Clicks Drop % = (Product List Clicks – Product Details View) / Product List Clicks
- Product Detail Drop % = (Product Detail Views – Product Adds To Cart) / Product Detail Views
- Product Add to Cart Drop % = (Product Adds To Cart – Product Checkouts) / Product Adds To Cart
- Product Checkout Drop % = (Product Checkouts – Unique Purchases) / Product Checkouts
Follow the below guide to add calculated metrics.
Create other metrics similarly as shown the process above.
Conversion Rate & Sessions by Location
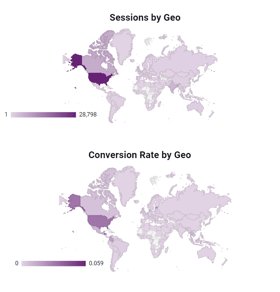
For some online businesses, customer location is an important thing. The above report is helpful in knowing where your potential customers are located and conversion rate by country.
The Bottom Line Reports
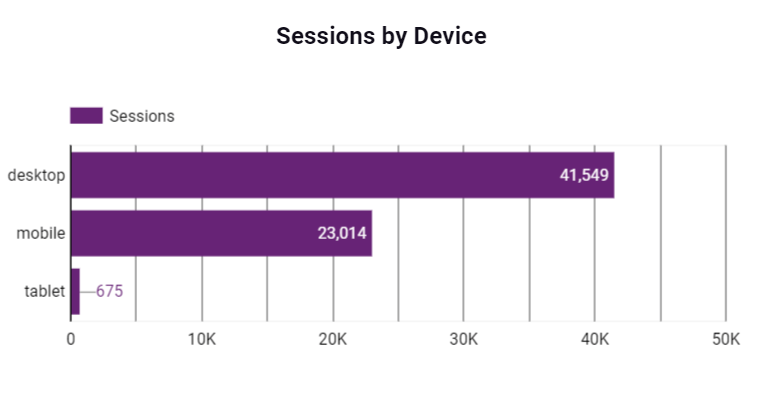
You must consider optimizing your website for every device. As seen in the above report, around 6000 sessions from mobile. So visitors should be able to easily purchase product using any device.
The pie chart indicates the age group that largely purchases from your store. The chart shows that half of the customers are between 24 – 34. So you should always keep products that this age group purchases and you should not be in out of stock.
If you think this is the best ecommerce template, then do let us know in the comments below and don’t forget to share.


