To use internet as a platform for boosting your sales, the efforts needed to achieve that involve a lot more than setting up a site. You need to understand how users react to, utilize and navigate through your site. Evidently, how they reach a conversion.
But here’s the thing; your users might surprise you, in ways you didn’t reckon. There is always this small element of unpredictability when it comes to analyzing human behavior.
You see, even if you have defined a funnel path, there are great chances for customers to swerve from it. They might skip a few steps, navigate back to a previous pages or just simply abandon the conversion process entirely.
Funnel Visualization or Goal Flow, what’s the difference?
A standard funnel visualization report, might overlook such discrepancies and is sometimes not flexible enough to cope with unexpected user behavior. This is where goal flows come in.
The Google Analytics goal flow report helps greatly in this case. It is a visualization of how users navigate through the goal funnel.
“The path your traffic follows towards a goal conversion is known as a funnel.
”
A goal flow breaks through the restricted aspects of a standard funnel visualization report and fragments the data into a more open and flexible format. It allows you to visualize loop backs, jumps and skips via a goal flow diagram.
If you run a website and have set up goals in Google Analytics, you might be interested in seeing daily, weekly or monthly goal conversions. But what about a goal funnel? That is where users enter your preset funnel and how they complete each micro conversion to reach upto a macro one.
By the end of this article, you will be able to set up a goal funnel and understand Google Analytics goal flow reports.
About the Goal Flow Report
Goal flow report in Google Analytics displays the path your visitors follow to complete a goal conversion. The path your traffic follows towards a goal conversion is known as a funnel. The goal flow report helps you observe how your traffic navigates through the funnel and whether there is a high drop-off rate or an unexpected loop.
With Google Analytics goal flow reports you can:
- See the number of users dropping off at each funnel step
- See where users enter your funnel. Whether it is the first step or somewhere in the middle?
- Check for unexpected loops on a certain step
- See if a certain segment acts differently than the rest of the traffic.
- Compare sources and conversions
- Perform analysis
- Improve user engagement
- Detect and fix site performance issues.
Accessing the Goal Flow Reports
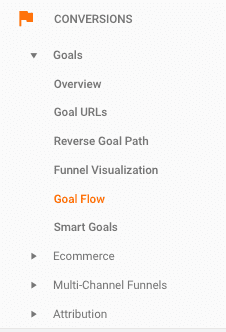
To access goal flow reports, navigate to Conversions >> Goals >> Goal Flow
The Prerequisites
To access the goal flow report you must have at least one goal in the specific view setup. To view the funnel visualization you are required to have added the funnel steps.
Creating Goals & Funnel in Google Analytics
Without having to implement a goal and setting up a funnel, you would never understand the goal flow & visualization reports.
Let’s take an example of ecommerce website where we will set up a purchase, complete a goal and include funnel steps to carry out a purchase.
To create the goal, navigate to Admin >> View >> Goals >> New Goal.
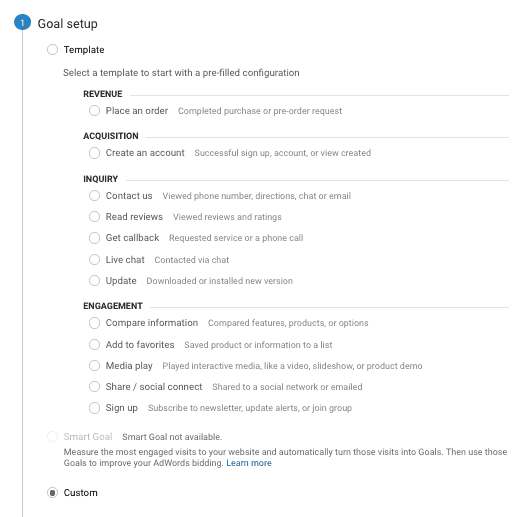
Select Custom under the goal setup and click continue
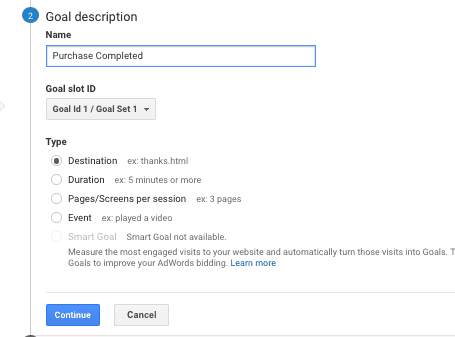
Enter the goal name as ‘purchase completed’ and select the type as destination
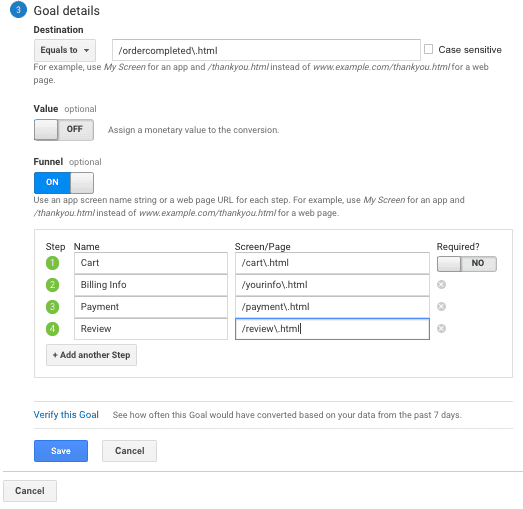
Under the goal details enter the order completed url.
To add your funnel steps, turn on the funnel switch. The funnel would be the pages a user clicked through to complete a purchase. Your funnel might be Product Page >> Add to Cart >> Billing >> Payment >> Review.
Add the funnel similar to the screenshot below but make sure to add the URL your web pages have and not the ones from the image.
Save this goal and wait for a day to actually see the funnel in Google Analytics.
How to Select Funnel Steps
For an ecommerce website, choosing the funnel steps is much easier because your end goal is to sell a product. So you will include the steps that are required to complete a purchase.
The difficulty comes in with a non-ecommerce site with just a contact us page. How would you define a funnel when you don’t have any add to cart or a review page? For a pro analytics user, it should not be a big problem but intermediate users might feel a little uncomfortable.
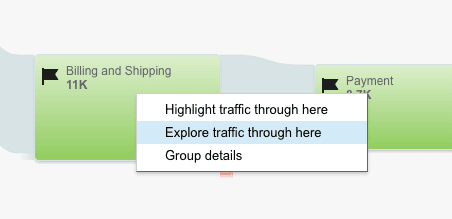
To build funnel steps click on any of the node and select “explore traffic through here”.
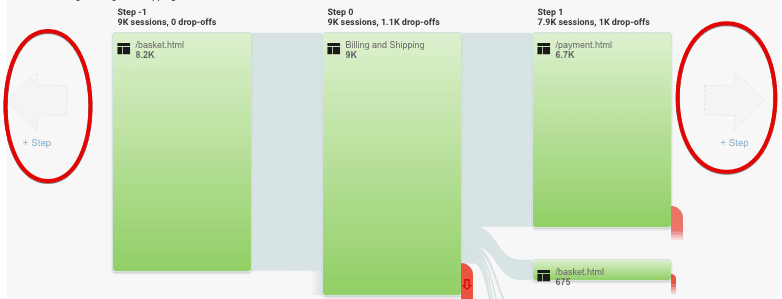
You can then check the previous and next steps from the specific node by clicking on the step button.
By using the “explore traffic through here” feature, you can track a funnel step or create a new funnel tracking backwards or forward. You can also user the user flow report to build funnel for any page.
Understanding the Goal Flow Funnel
Like other flow reports in Google Analytics, goal flow also consist of nodes, connections and exits. To better understand it, let’s jump to the important stuff..
Selecting Between Goals & Goal Funnel
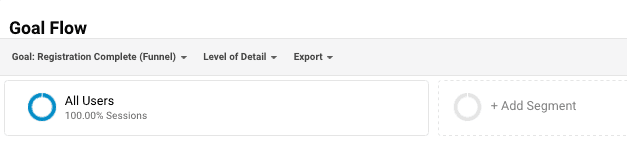
On the top of goal flow is the navigation menu. From the goal drop-down menu, you can select a single goal or the funnel to display reports. From the “Level of Detail” dropdown you can adjust the number of connections displayed in the graph. By clicking the export tab you can export this report to a PDF format.
Changing the dimension

To change the starting dimension click on the drop-down and select the dimension according to your need. For example, changing the dimension to social networks will display the visualization based on traffic coming from top social networks.
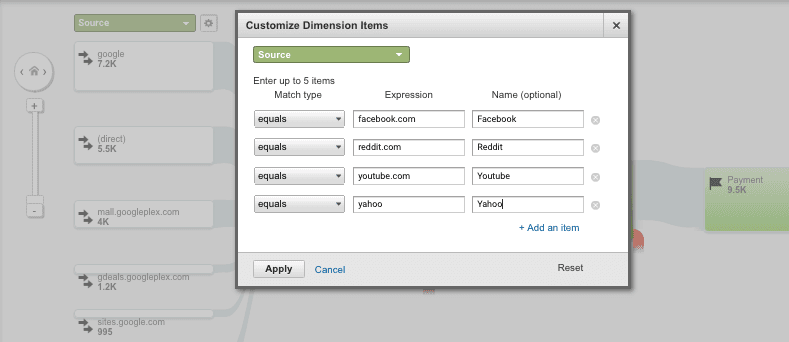
Selecting Customized Dimensions
To customize the values of dimensions, click on the settings icon next to the dimension menu and you can add up to 5 regular expressions to customize it.
Understand loop backs and drop offs
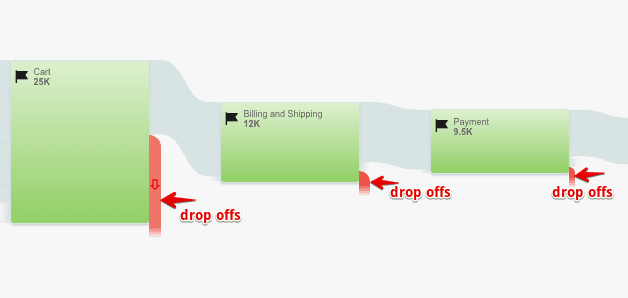
The most essential use of goal flow report is you can track the number of users dropping off the conversion funnel or any irregular loops within the funnel steps.
In the below funnel, the red lines indicate the number of users dropping off on each funnel step. With the goal funnel, you can actually see the number of users entering the funnel and those ending up purchasing your product.
To check for any loop backs in your conversion funnel click on any of the connection or click on a node and select “highlight traffic through here”.
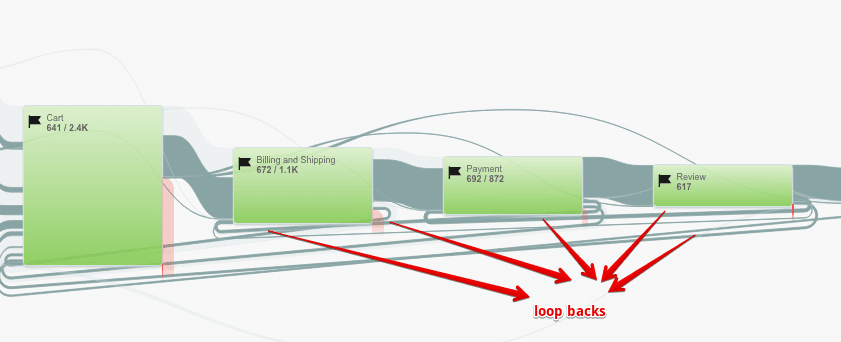
A large number of loop backs might indicate any errors on the specific steps or users experiencing difficulty in going to the next step. You can then look for specific funnel steps and check for any internal error or make the step more user friendly or provide the missing details. w
Until now, you should be able to set up a goal funnel track user engagement on each of the funnel step by using the goal flow report. By digging into the goal flow reports, you can actually explore the specific points where your customers jumps off the funnel. If you have any question related to goal flow please let me know in the comments below.