Introduction
Auditing a Google Analytics Account can be time consuming. Having to switch between reports, cross checking data in multiple tabs, building custom reports can become a repetitive process. However combining the knowledge of a Google Analytics audit process and looker studio we came up with a unique solution to maximize productivity and minimize the time for the audit process.
Why Google Diagnostic Dashboard?
Auditing Current Google Analytics setup required us to manually navigate to Google Analytics reports and analyze the data using different filter conditions, segments and across different data ranges to validate and verify data. GA reports are not really built for audits this helps us use filters / segments and all the power of lookerstudio to purpose build the report for our use.
Key Benefits
-
An ordered approach to the audit process
-
Overall Google Analytics performance overview
-
Spam detection (using ISP Domain & standard filters)
-
Quick Overview of E-commerce data and its key issues
-
Analysis of Adwords Linking & Campaign data
-
Identify incorrect or missing event parameter data.
-
Overview of Goals and custom dimensions setup
-
Analyze trends across Last Month (Breakdown days) & Current Year (Breakdown Months)
-
Reusability, using the data switch filter easily see data across all available views/properties/accounts in your GA Account.
The Diagnostic Dashboard is organized into different sections based on Google Analytics reports commonly used in the audit process. Let’s go through each section step by step,
Source/Medium & Traffic Performance
 Source/Medium & Traffic Performance
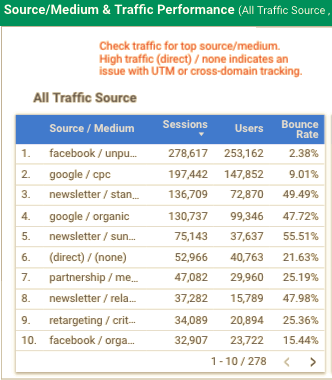
This section corresponds to Acquisition > All Traffic > Source/Medium Report and Referral Traffic. It also shows the sessions and bounce rate over the period of 30 days and 1 year.
What you need to check here
Top Source/Medium
-
High traffic from direct/(none) indicates some potential issues with UTM or cross-domain tracking
-
All the payment gateways and self-domain must be included in the referral exclusion list. Click on Source Filter and type in your domain name to verify if it is added in referral exclusion
-
Payment gateway referrals (pay.amazon.com, paypal.com, pay.shopify.com, infusionsoft.com, payu.com)
Spam Traffic
 Spam Traffic
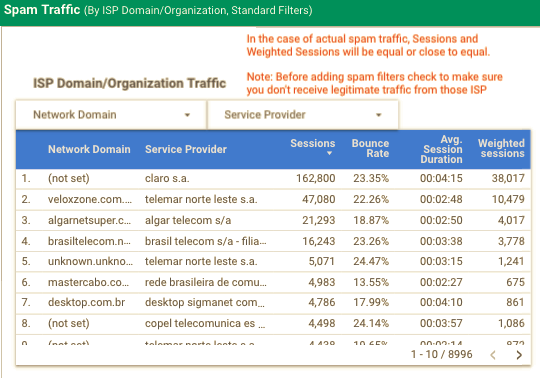
Detecting spam from normal traffic can be a tricky task, there are many dimensions available within GA that can be used along with metrics to identify possible source of spam traffic
What you need to check here
-
One method to identify probable spam traffic is to use Network Domain and Service Provider dimensions that identify any spam ISP domains. But not all traffic in this can be considered spam so we added an extra metric for and weighted sessions (sessions*bounce rate) if value of this metric is equal/close to values of sessions it could mean a potential spam traffic. (Experimental)
-
Traffic recorded from Known Spam Sources. (For details of spam sources.
(Note: Detecting spam traffic is tricky only add spam filters in GA if you are sure about not receiving any legitimate traffic from a Source or ISP Domain/Organization)
Page performance
 Page Performance
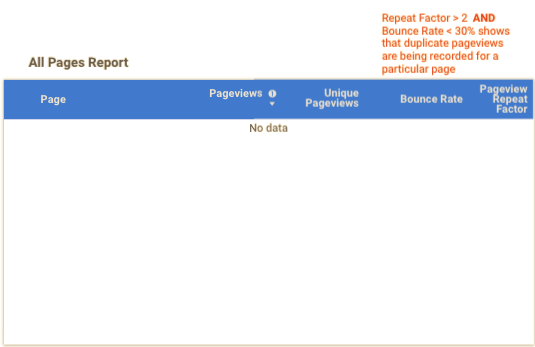
This sections corresponds to Behavior > Site Content > All Pages Report.
What you need to check here
– Potential Duplicate Pageviews – pages having repeat factor (total page views/unique page views) greater than 2 and the bounce rate less than 30%. (Experimental)
– Whether content grouping is setup or not.
Adwords linking and Campaign Performance
 Adwords Linking & Campaign Data
What you need to check here
-
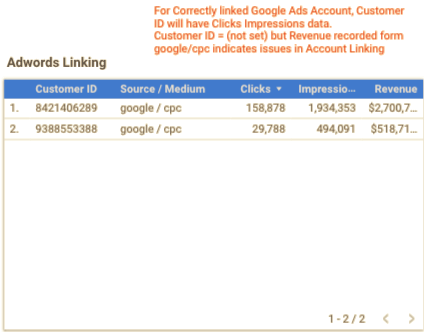
Google Ads linking with Google Analytics. For correctly linked Google Ads account, customer ID will have clicks and impressions data.
-
Customer ID = (not set) but revenue recorded from google paid sources shows the potential issues in Adwords linking with Google Analytics.
Event Performance
 Event Performance
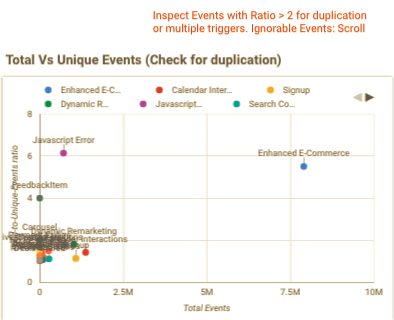
This section corresponds to Behavior > Events > Top Events Report.
What you need to check here
-
Issue in event parameters (Action and label) recorded in Google Analytics. Table is filtered to show only instances where either event parameters are (not set) or undefined.
-
Duplicate events – the Scatter plot shows a comparison between total events and total-to-unique event ratio.
E-commerce & Product Performance
This section helps us verify that the data is being recorded for all enhanced e-commerce steps in case of e-commerce website.
What you need to check here
-
Check for discrepancy between Total revenue and Product revenue. In case of discrepancy further investigation in GA is required.
-
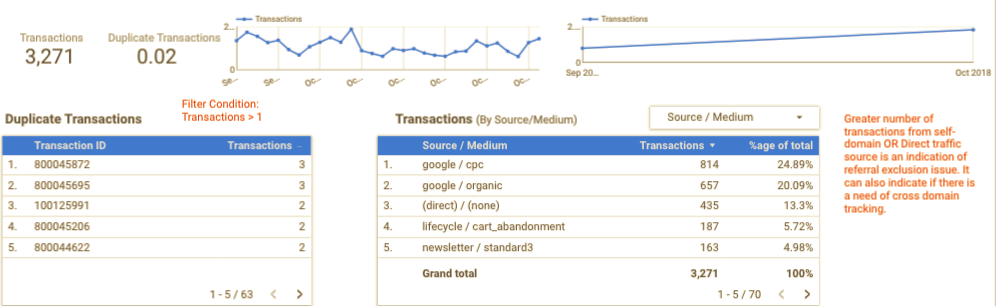
Duplicate/Multiple Transaction ID – Each transaction ID is unique for every transaction recorded. The table at the bottom shows those transactions ID`s having transactions greater than 1, providing on spot evidence of the issue.
-
Transactions by Source/Medium shows if there is a need of cross-domain tracking or if the domain is not added in referral exclusion list.
 Transaction
Goal Performance
This sections shows the goal competitions and goal conversion rate for all the goals setup in Google Analytics.
What you need to check here
-
Values for goals completions and goal conversions.
-
The graphs showcase the trend in goal completions over the period of last 30 days and the current year. The goal limit in a Free Google Analytics account is 20.
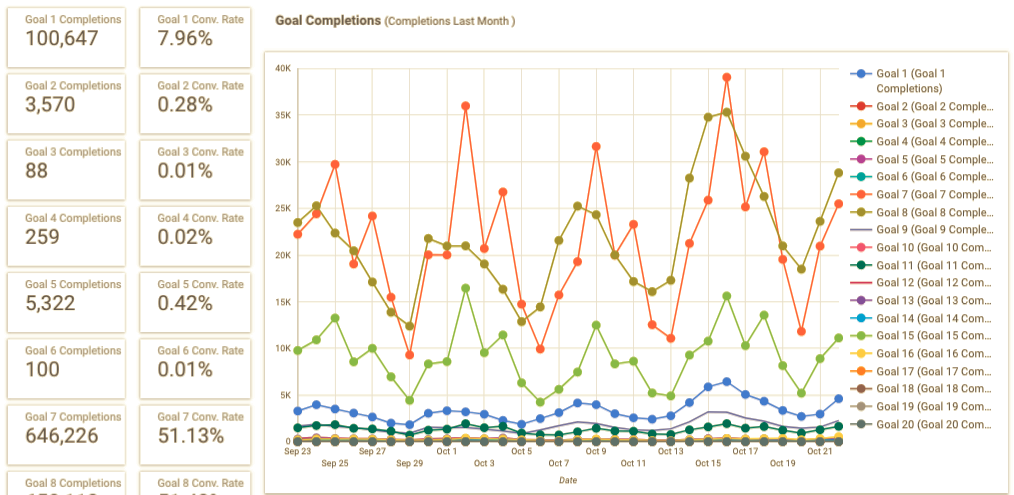 Goal Performance Section over last month
Custom Dimensions
Custom dimensions are used to pass some additional useful information along with Google Analytics.
What you need to check here
-
If any custom dimensions are set up and are being recorded correctly as per their scope. Metrics used to match scope (Session, Page views, Total Events)
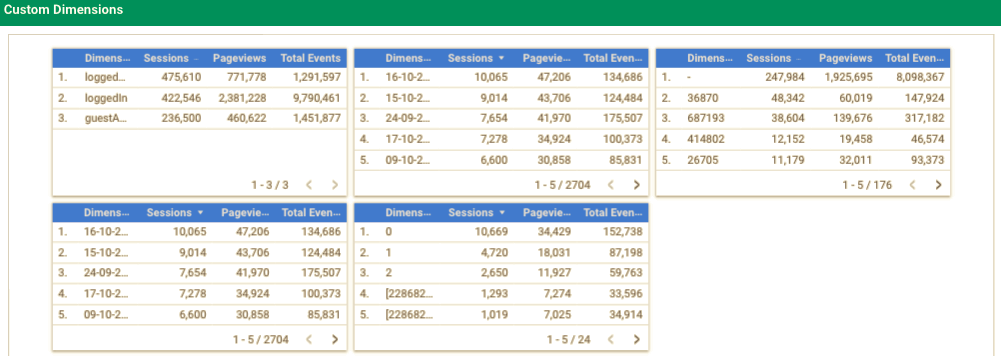 Custom Dimension
Results
At MarketLytics we do ALOT of audits we audit when we onboard clients and when we complete projects this has made the process a lot simpler and saved us about a couple of hours per audit which was previously spent manually pulling the reports.
Its also streamlined the audit process as any team member can edit and tweak the report and any new audits will see those things showup.
How to Use Dashboard?
-
The dashboard uses Looker Studio’s built in Viewer credential so all you need to do is click below and select your Google Analytics account and voila!
“Google Analytics Diagnostic Dashboard is actively being maintained by my awesome colleagues Taha, Arsalan.”