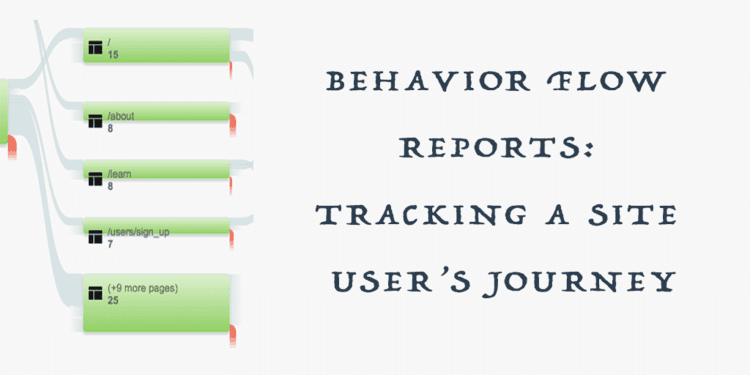
If you’ve a website, chances are you keep track of how many hits or sessions your website gathers over a certain period of time. But what about the journey of the user who visits your website? Wouldn’t you want to know what brought a user to your turf, what sections of the website caught the user’s attention and at which point did the user exit?
Behavior Flow in Google Analytics let you know just that. They visualize the path a user follows on your website.
What is Behavior Flow in Google Analytics?
Behavior flow visualizes the path a user follows from one page to the next or from one event to another. A path can be multiple pageviews or just a single pageview during a session.
Let’s say a user lands on the “Blog” page, goes to the “Resources” page and then to “Contact Us” before leaving. The user path would then be blog -> resources -> contact us.
Why should you look at Behavior Flow Reports?
Well, here are two reasons why:
- The reports help you identify the most engaging content on your website.
- They also help identify problem areas and potential content issues.
Here’s what you need to get Behavior Flow Reports
- Ample amounts of data to generate reports.
- Have events and content grouping set up before they can appear in the flow reports.
Accessing Behavior Flow Reports
To get to the reports, follow these steps:
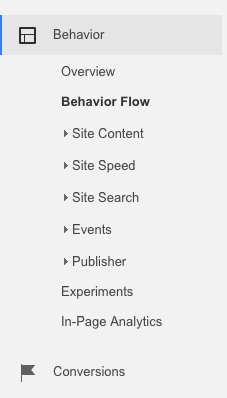
In your Reporting Tab, navigate to Behavior >> Behavior Flow
 Behavior Flow Google Analytics

Let’s explore this further and try to understand how to use Behavior Flow Reports.
Using Behavior Flow in Google Analytics
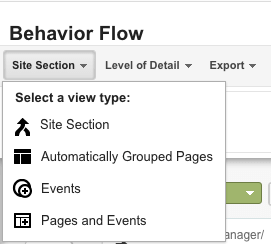
On the top right corner of the Behavior Flow Reports, you can “Select a view type” and see the user flow according to content grouping, automatically grouped pages, events or according to both pages & events.
 viewing behavior flow reports
Let’s find out what each of the view types tell us.
Content grouping
Content grouping is a characteristic of Google Analytics that lets you organize site pages into different groups so that you can compare metrics aggregated under each group.
To see the flow reports for content groups you have to first create your content grouping by navigating to admin >> view >> content grouping.
When you select “content grouping” as your view type, the Behavior Flow Reports will show you how a user navigates according to the content group you selected. This will in turn tell you which groups are performing well and which ones needs improvement.
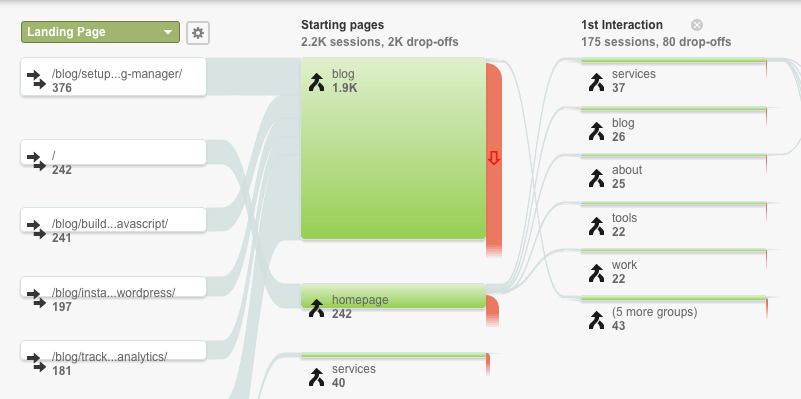 view by content grouping behavior flow reports
Read more about creating/editing content grouping in Google Analytics here.
Automatically Grouped Pages
To view the user flow according to automatically grouped pages, select the view type as “automatically grouped pages”.
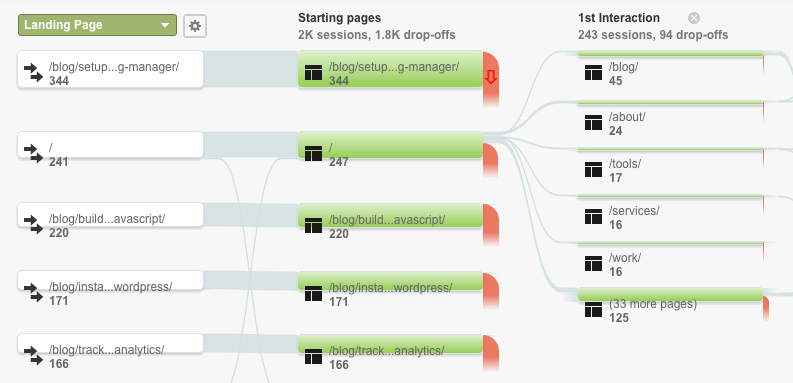 Automatically grouped content behavior flow
Events
Selecting “Events” as view type shows the user flow based on the events a user completed during his/her visit. It also shows how a user behaves per different event type and the events which are more engaging to the user. For viewing user flow according to “events”, you must have already created events.
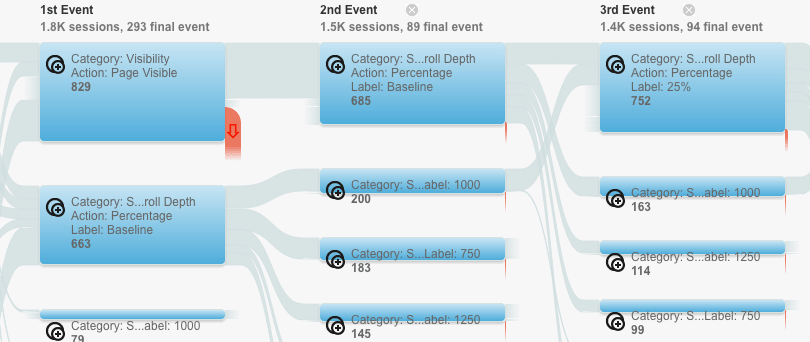 view type as event
Read more about setting up events in Google Analytics.
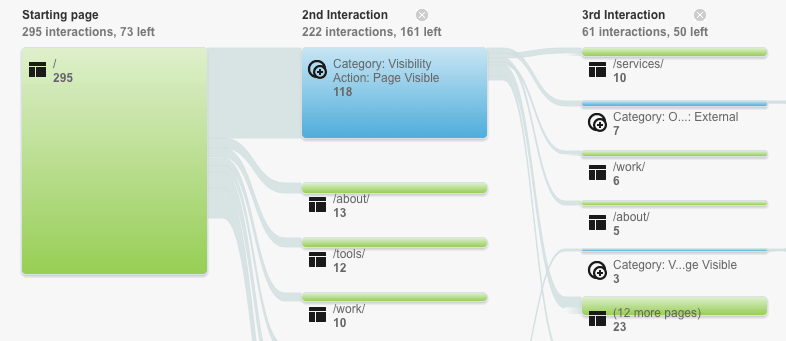
Pages & Events
You can also see the combination of both pages and events in the Behavior Flow Reports. These report will let you differentiate between the performance of events and pages.
 view type as events & pages
On a side note: Nodes, Connections & Exits
In order to better understand user flow, it is important to also understand the structure of behavior flow. The flow report consists of some elements which are necessary to use the report (?).
- Nodes are points through which traffic flows and each node represents different dimensions according to the view you have chosen.
- A connection represents the path from one node to the next and the volume of traffic it flows.
- An exit indicates where the user left the flow.
Behavior Flow VS User Flow
Behavior Flow visualizes the path a user follows from page to page or from event to event. These reports can display data according to content grouping, events, automatically grouped pages or both pages & events.
User flow reports compare volumes of traffic from different sources. This shows which marketing channel is driving more traffic to your website.
Read more: See how Users traverse and interact with your site
With this, we come to the end of our introduction to the Behavior Flow Reports. Our next article will explore hidden features and the insights we can get from the reports. Follow us on twitter or signup for our newsletter to get an update.
Frequently Asked Question:
Q. I don’t see any data in the Behavior Flow Report. What do I do?
A. To view Behavior Flow Reports you should have at least a week or two of data collected in your Google Analytics.